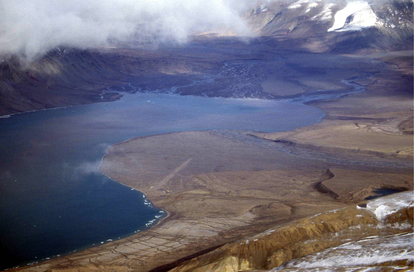
 The data rescue intern: Fiel Dimayacyac My data rescue internship was centered on climate data from Parks Canada from Nunavut national parks under the guidance of researcher Florence Lapierre Poulin. The data were collected from four different weather stations: Tanquary Fjord, Lake Hazen, Ward Hunt, and Conger Island from 1989 until 2019. Data were downloaded annually from the weather station sensors at each location and were recently amalgamated into a single database by Florence. Many researchers wish to use the data, but the state of the database was problematic at the time for multiple reasons. The data collection methods were inconsistent between years as sensors where replaced or upgraded over the years and as a result different headers for the same variable existed, or certain time spans were missing headers, or there were inconsistencies with units of measurement as well as of time. In some cases values were in error or unrealistic for various reasons (sensor error). Due to time constraints, Florence needed a data rescue intern to aid in the cleaning, formatting, and streamlining of the data so that it could be easily shared on the Open Government data portal.
During my internship I accomplished the following; I first separated the database into Comma Separated Values (CSV) files according to data type (hourly or daily readings) and location (Tanquary, Hazen, etc.). I did this to allow researchers to more easily parse readings into analysis software as most programs do not accept Excel spreadsheet files with multiple tabs. Secondly, much of the data was separated into chunks of time, e.g., 1989-2007 and 2007-2013, so I worked to fuse the data chunks within data types and locations so that each location had only one CSV for each data type encapsulating all the years of readings. This process involved aggregating redundant (repeated) columns. Columns, like relative humidity, were recorded by multiple sensors at the same location, and different names between sensors. This process also included standardizing timestamps between years and locations. Finally, I plotted data values across the year ranges to identify when data seemed off to discern if there were issues with sensors and/or units. When data was obviously incorrect I searched the raw files for any comments regarding those year ranges and identified issues with sensor icing and power outages. These issues and more were logged via various Error codes. Additionally, I created separate metadata files containing descriptions of the various headers, units, and interpretations, as well as a legend for error codes and the full text of any logged errors. I also created a data management plan for future database managers so that they could easily upload data in a manner that would keep the data clean and easily managed. Comments are closed.
|
Archives
October 2023
Categories |

 RSS Feed